It must be a challenging and confusing time to be shopping for a new car if you’re particularly keen to buy one that will save you a few quid at the petrol pumps and/or on company car tax.
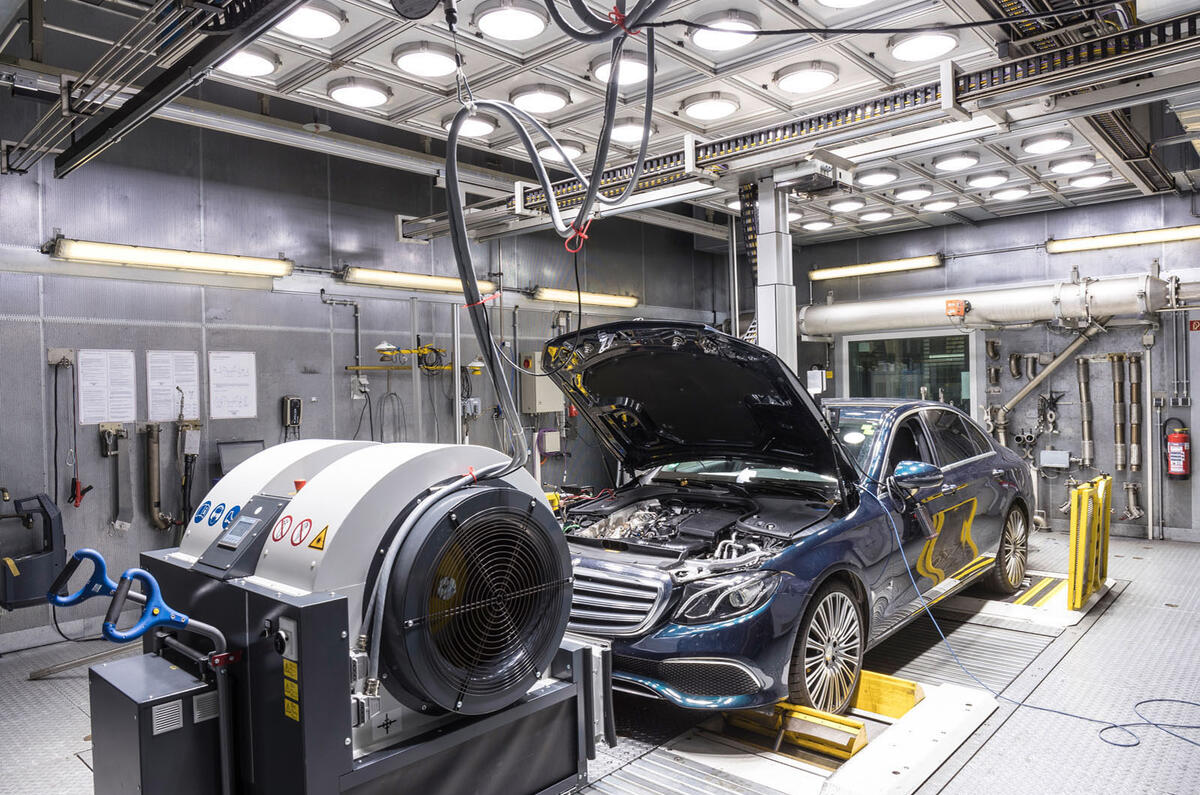
Right now, most manufacturers have banished any vestige of the old NEDC-standard economy and CO2 emissions data from their brochures and websites, instead quoting NEDC Correlated numbers.
Oddly enough, these aren’t numbers generated by the old NEDC lab test at all; they're converted from new WLTP lab test results in order to represent something closer to the NEDC standard. It wouldn’t do, after all, if the car you were about to buy looked worse on fuel efficiency compared with the one you were giving up; and, to be fair, that probably wouldn’t represent its true performance on the road, either.
To make matters even more brain-addling, though, some manufacturers have already made the switch to properly identified WLTP statistics for fuel economy while sticking to NEDC Correlated CO2 numbers. That's because NEDC Correlated are the numbers relevant to both European manufacturer fleet emissions quotas and, for this year at least, company car tax liability.
So, in among all that, what strategy should Autocar take in order to try to deliver clarity amid the chaos? Well, we’ve been mulling it over. And we’ve decided the most sensible plan is to futureproof our reviews as much as possible by quoting only WLTP fuel economy and CO2 figures where possible; even if a manufacturer would prefer to give us NEDC Correlated data, we'll acquire data on the latest standard wherever we can.
Company car tax: what you need to know
So, in order to provide as fair and clear a basis for comparison as possible, you’ll only ever see WLTP combined fuel economy figures in Autocar’s first drive reviews, features and comparison tests, as well as the data pages of our magazine. These are the aggregated result of four lab tests carried out across as many different cruising speed ranges, although they’re sometimes expressed as a range rather than one specific figure in order to show the different results recorded by the various specifications of the car in question (including optional equipment).
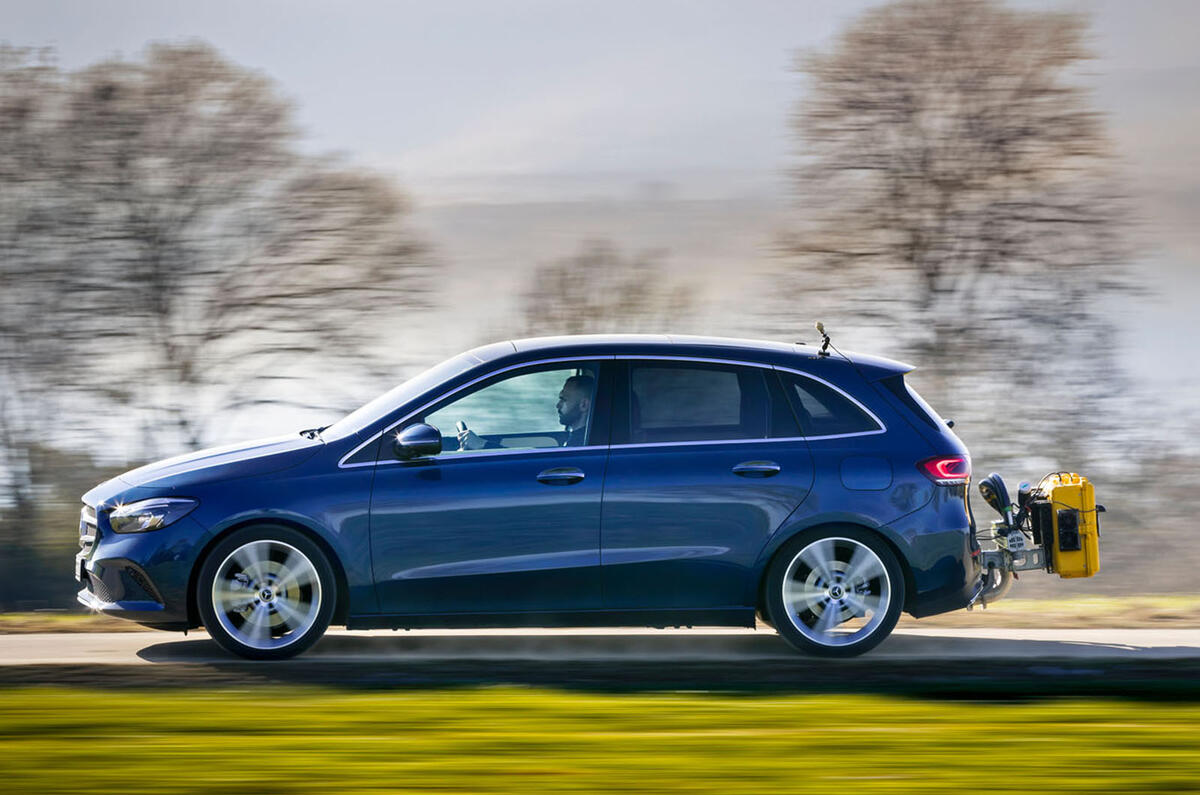
In full road tests, you’ll also see our own independently produced real-world fuel economy test results referred to, of course, for comparison with the lab test claims. We produce an ‘average’, ‘track’ and ‘touring’ figure for each car we test, as often as possible, on a brim-to-brim basis. And while 'average’ represents the overall economy returned by a car over a full road test and ‘track’ is relevant only to intensive performance testing (the length and conditions of which can vary slightly), ‘touring’ gives the best guide to the kind of economy you'll get from a car at a steady 70mph UK motorway cruise.
We do real-world efficiency and range testing on electric cars, too, expressing the former in terms of miles per kWh, as manufacturers do increasingly widely by convention.





Join the debate
Add your comment
The only sensible option
Great. Adopting the WLTP figures is the only sensible thing to do to enable fair comparison between different cars using a standard controlled test. Frankly I'm not that interested in "real world" figures, or even road test ones, which are subject to different drivers and driving styles and different road, traffic and weather conditions.
I just wish manufacturers would be a little more consistent instead of quoting WLTP figures for fuel economy and NEDC-correlelated ones for CO2, effectively using two different measurement processes for the same thing. And let's hope there will be less cheating!
It's just a shame that WLTP (WORLD harmonised Light vehicle Test Protocol) has become a European standard rather than a global one, with other countries still using different procedures which cannot be compared.
About time really......
Have to say that finally a system where it should agree with what most of us knew years ago that mpg figures then when were at least 20% optimistic, the new system is almost spot on...
Well the conversion factor...
...from NEDC to Real World was around -25 to -30% (Official ~50 mpg, real world ~36 mpg). One assumes there will be a conversion factor from WLTP to Real World too, albeit a smaller percentage since the Real World figure will remain the same.